Monitoring Availability Groups with Redgate SQL Monitor
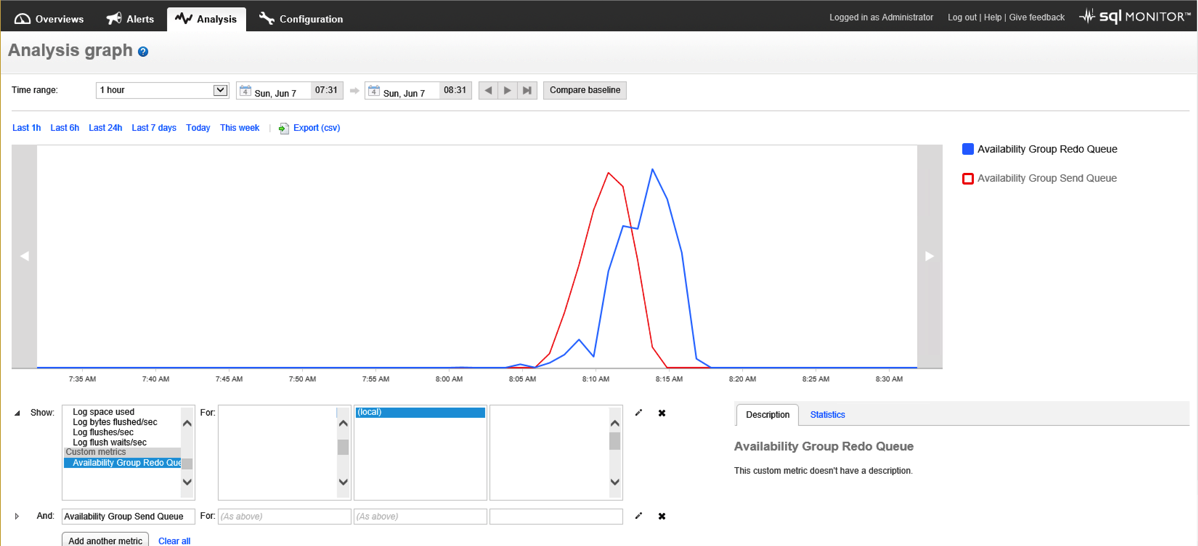
In previous posts here and here we discussed AlwaysOn Availability Group replication latency and monitoring concepts, specifically the importance of monitoring the send_queue and redo_queue. In this post I’m going to show you a technique for monitoring Availability Group replication latency with Redgate SQL Monitor and its Custom Metric functionality.
Here’s the rub, monitoring AGs is a little interesting for the following reasons
- We’re interested in trending and monitoring and that isn’t built into SQL Server or SSMS’s AlwaysOn Dashboard. Both provide only point in time values.
- We’ll need to monitor the health of the Availability Group as a whole. So we want to track performance data on all replicas in the AG. But interestingly the redo queue and send queue values in the DMVs on the primary are always NULL. So we need to get those values from the secondary replicas.
- Further, to work this into SQL Monitor’s Custom Metric framework we’ll need to limit our query’s result set to a single row and value.
Redo Queue
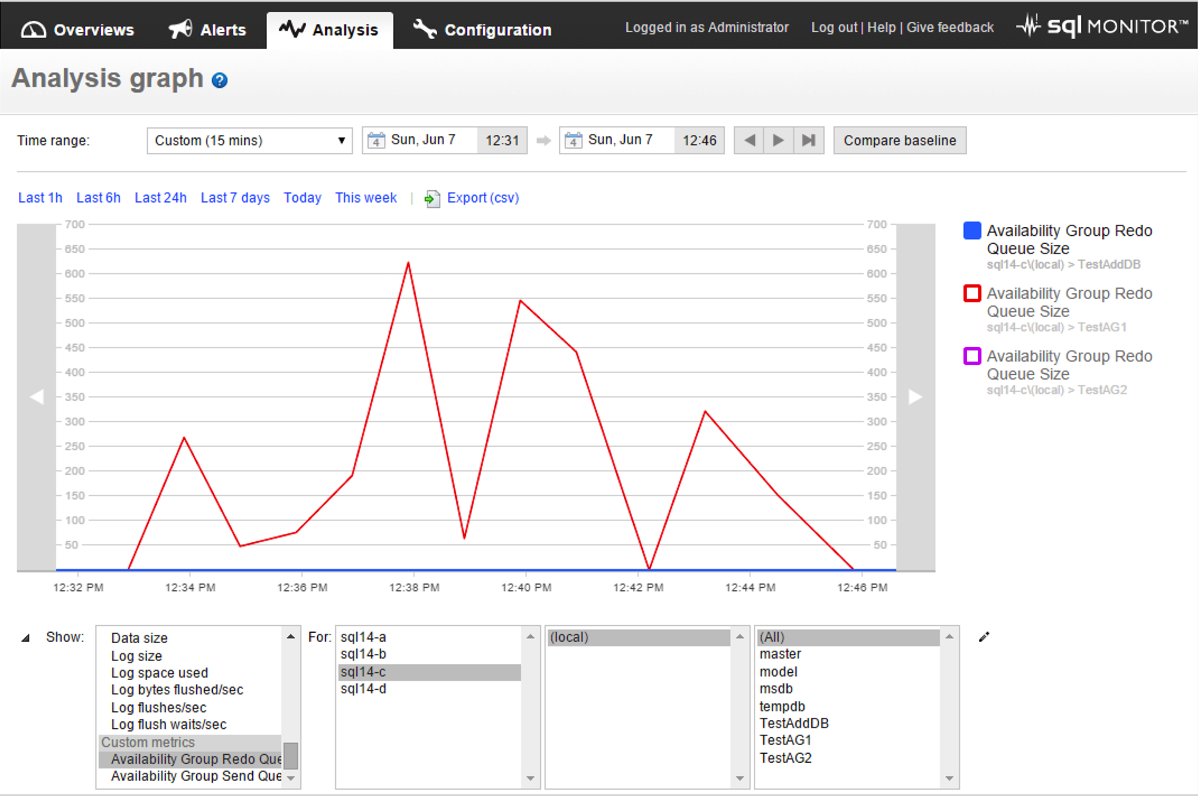
The redo queue is the amount of log records that haven’t been sent to a secondary replica in an AG. We want to track this as it is a measure of the amount of data on a secondary that is not yet redone into the database and can impact operations offloaded to secondaries
The bold text headings of the next section match the configuration areas on the Custom Metric screen in SQL Monitor.
Enter the T-SQL query that will collect data:
SELECT  rs.redo_queue_size
FROM    sys.dm_hadr_database_replica_states rs
        JOIN sys.availability_replicas r ON r.group_id = rs.group_id
                                            AND r.replica_id = rs.replica_id
WHERE   rs.database_id = DB_ID()
        AND r.replica_server_name = @@SERVERNAME
        AND rs.redo_queue_size IS NOT NULL;
This query will execute on each replica in the AG and will return data only for that replica. So if a replica does go offline we will loose the ability to query its information…but hey it’s offline. So it will be pretty hard to query regardless. But in reality this isn’t really good since the send queue values on the primary are always NULL.
Select instance to collect from
Select all the instance that are in the AG you want to monitor. The T-SQL query will handle multiple Availability Groups as the query restricts its data to database ID on a particular server and a database can only be a member of one AG.
Choose databases to collect from
Please select all the databases that you are interested in monitoring.
Set collection frequency
Collect data every minute. I wish we could set this to a lower value.
Use collected or calculated values
Leave this unchecked. The DMVs queries return point in time values that we’ll want to graph the data as absolute values.
Send Queue
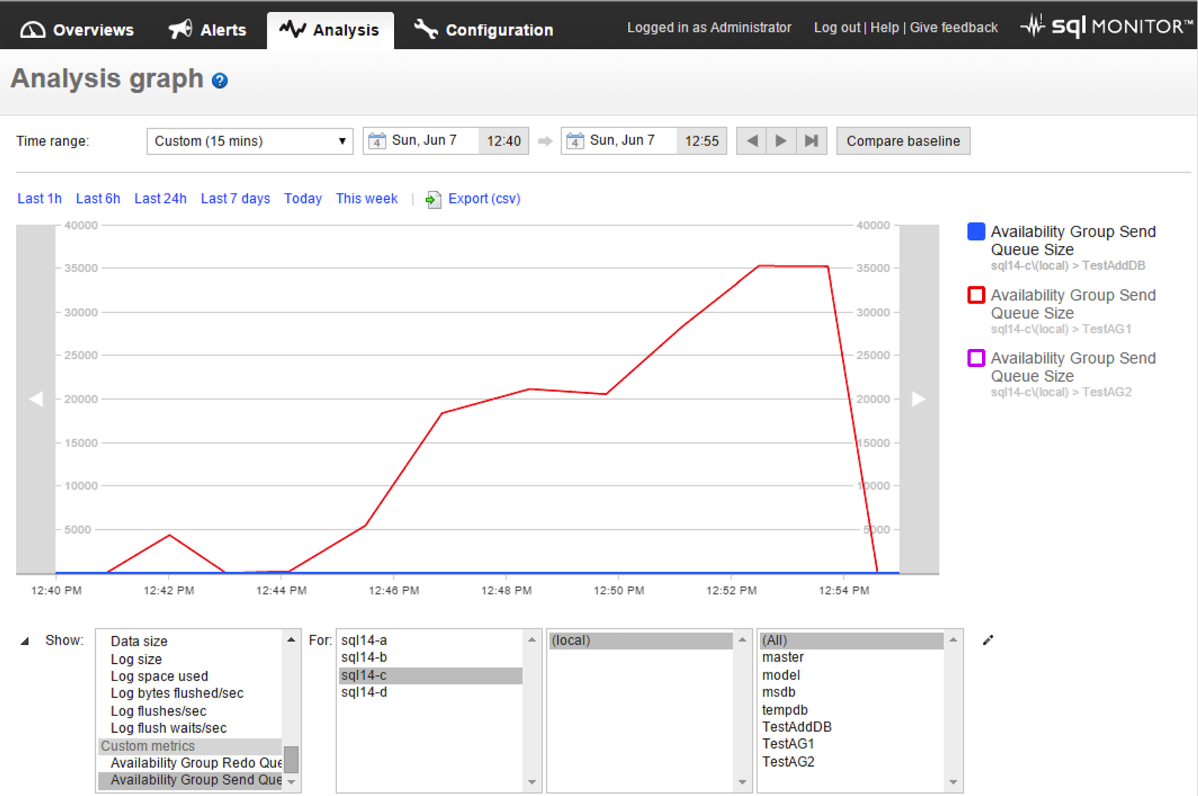
The send queue is used to store log records that will be sent from the primary to the secondary replica. We want to track this as it is a measure of the amount of data that is not on a secondary replica and can impact recovery point if there is a failure of a primary.
All of the configuration settings for this Custom Metric are the same as above except the T-SQL Query. Here’s that code:
Enter the T-SQL query that will collect data:
SELECT  rs.log_send_queue_size
FROM    sys.dm_hadr_database_replica_states rs
        JOIN sys.availability_replicas r ON r.group_id = rs.group_id
                                            AND r.replica_id = rs.replica_id
WHERE   rs.database_id = DB_ID()
        AND r.replica_server_name = @@SERVERNAME
        AND rs.log_send_queue_size IS NOT NULL
Send Queue Custom Metric Analysis

Redo Queue Custom Metric Analysis

