Monitoring with the Pure Storage FlashArray OpenMetrics Exporter
Update (February 2026): This post has been updated to reflect the current best practices for monitoring FlashArray using OpenMetrics. Starting with Purity//FA 6.7.x, FlashArray includes a native OpenMetrics exporter, eliminating the need for a separate exporter service/container. The configuration examples below now demonstrate direct-to-array scraping.
This post introduces you to monitoring your Pure Storage FlashArray using OpenMetrics. It shows you how to get started quickly using Docker Compose to monitor your Pure Storage FlashArray environment.
I implemented this in Docker Compose since it handles all the implementation and configuration steps for you. It specifically configures Prometheus’ data source and a Grafana dashboard for monitoring.
Tip: If you’re building a persistent monitoring solution, I suggest using a dedicated Linux server running Docker Engine (Server) for Linux. If you’re testing out this solution check out Docker Desktop on your operating system choice. In my lab, I’m using Docker Engine on Ubuntu.
The monitoring stack
First, let’s break down each element in this monitoring stack since several pieces come together to provide you with a monitoring platform.
-
FlashArray Native OpenMetrics Exporter (Purity//FA 6.7.x+) - Starting with Purity//FA 6.7.x, FlashArray includes a built-in OpenMetrics exporter that exports health and performance data directly from the array. No separate exporter service or container is needed.
-
Pure Storage FlashArray OpenMetrics Exporter (Purity//FA ≤ 6.6.x) - For older Purity versions, this open-source application exports health and performance data from FlashArray. Note: This exporter reached End-of-Life (EOL) in September 2024.
-
Prometheus - A time series database that stores the performance metrics. Prometheus scrapes metrics directly from your FlashArray endpoints and stores the data for querying.
-
Grafana - An open-source observability platform that enables you to build dashboards to visualize metrics, logs, and alerts from various data sources. In our monitoring stack, the data source is Prometheus.
Why would I use this?
This Docker Compose implementation is a great place to start, getting you up and running quickly with a configured monitoring stack. This is also helpful if you’re a Pure Storage customer and need to integrate FlashArray metrics into an enterprise monitoring platform.
Getting started
First, you’ll want to clone the Git Repo with git clone https://github.com/PureStorage-OpenConnect/pure-fa-openmetrics-exporter.git
Once the repo is cloned, you’ll want to configure your environment.
Configuration for Purity//FA 6.7.x and later (Native Exporter)
The configuration has been significantly simplified with the native exporter:
- Change into the directory
cd pure-fa-openmetrics-exporter/examples/config/docker. - Edit
./prometheus/prometheus.ymlfor the scrape configuration for your environment.- The configuration now scrapes metrics directly from your FlashArray via HTTPS (no separate exporter service needed)
- You’ll find examples for array, volumes, and hosts metric endpoints
- Update
authorization.credentialswith an API token from a read-only user on your FlashArray - Update the
targetsto point to your FlashArray FQDN or IP address (e.g.,arrayname01.fqdn.com) - The configuration includes
scheme: httpsandtls_config.insecure_skip_verify: truefor self-signed certificates - Each scrape job includes the
namespaceparameter set topurefafor proper metric namespacing - For help on creating a user account with an API token, check out this guide in the main repo
- Use
docker compose up --detachto launch the monitoring stack (now simplified to just Prometheus and Grafana). - Open a browser to http://localhost:3000 (or the IP address or DNS name of your monitoring server). The username is
adminand the password isadmin!.
What’s it look like
Once the monitoring stack is up and online you will be able to browse directly to the pre-configured dashboard named Pure Storage FlashArray - Overview and you will get a dashboard similar to this:
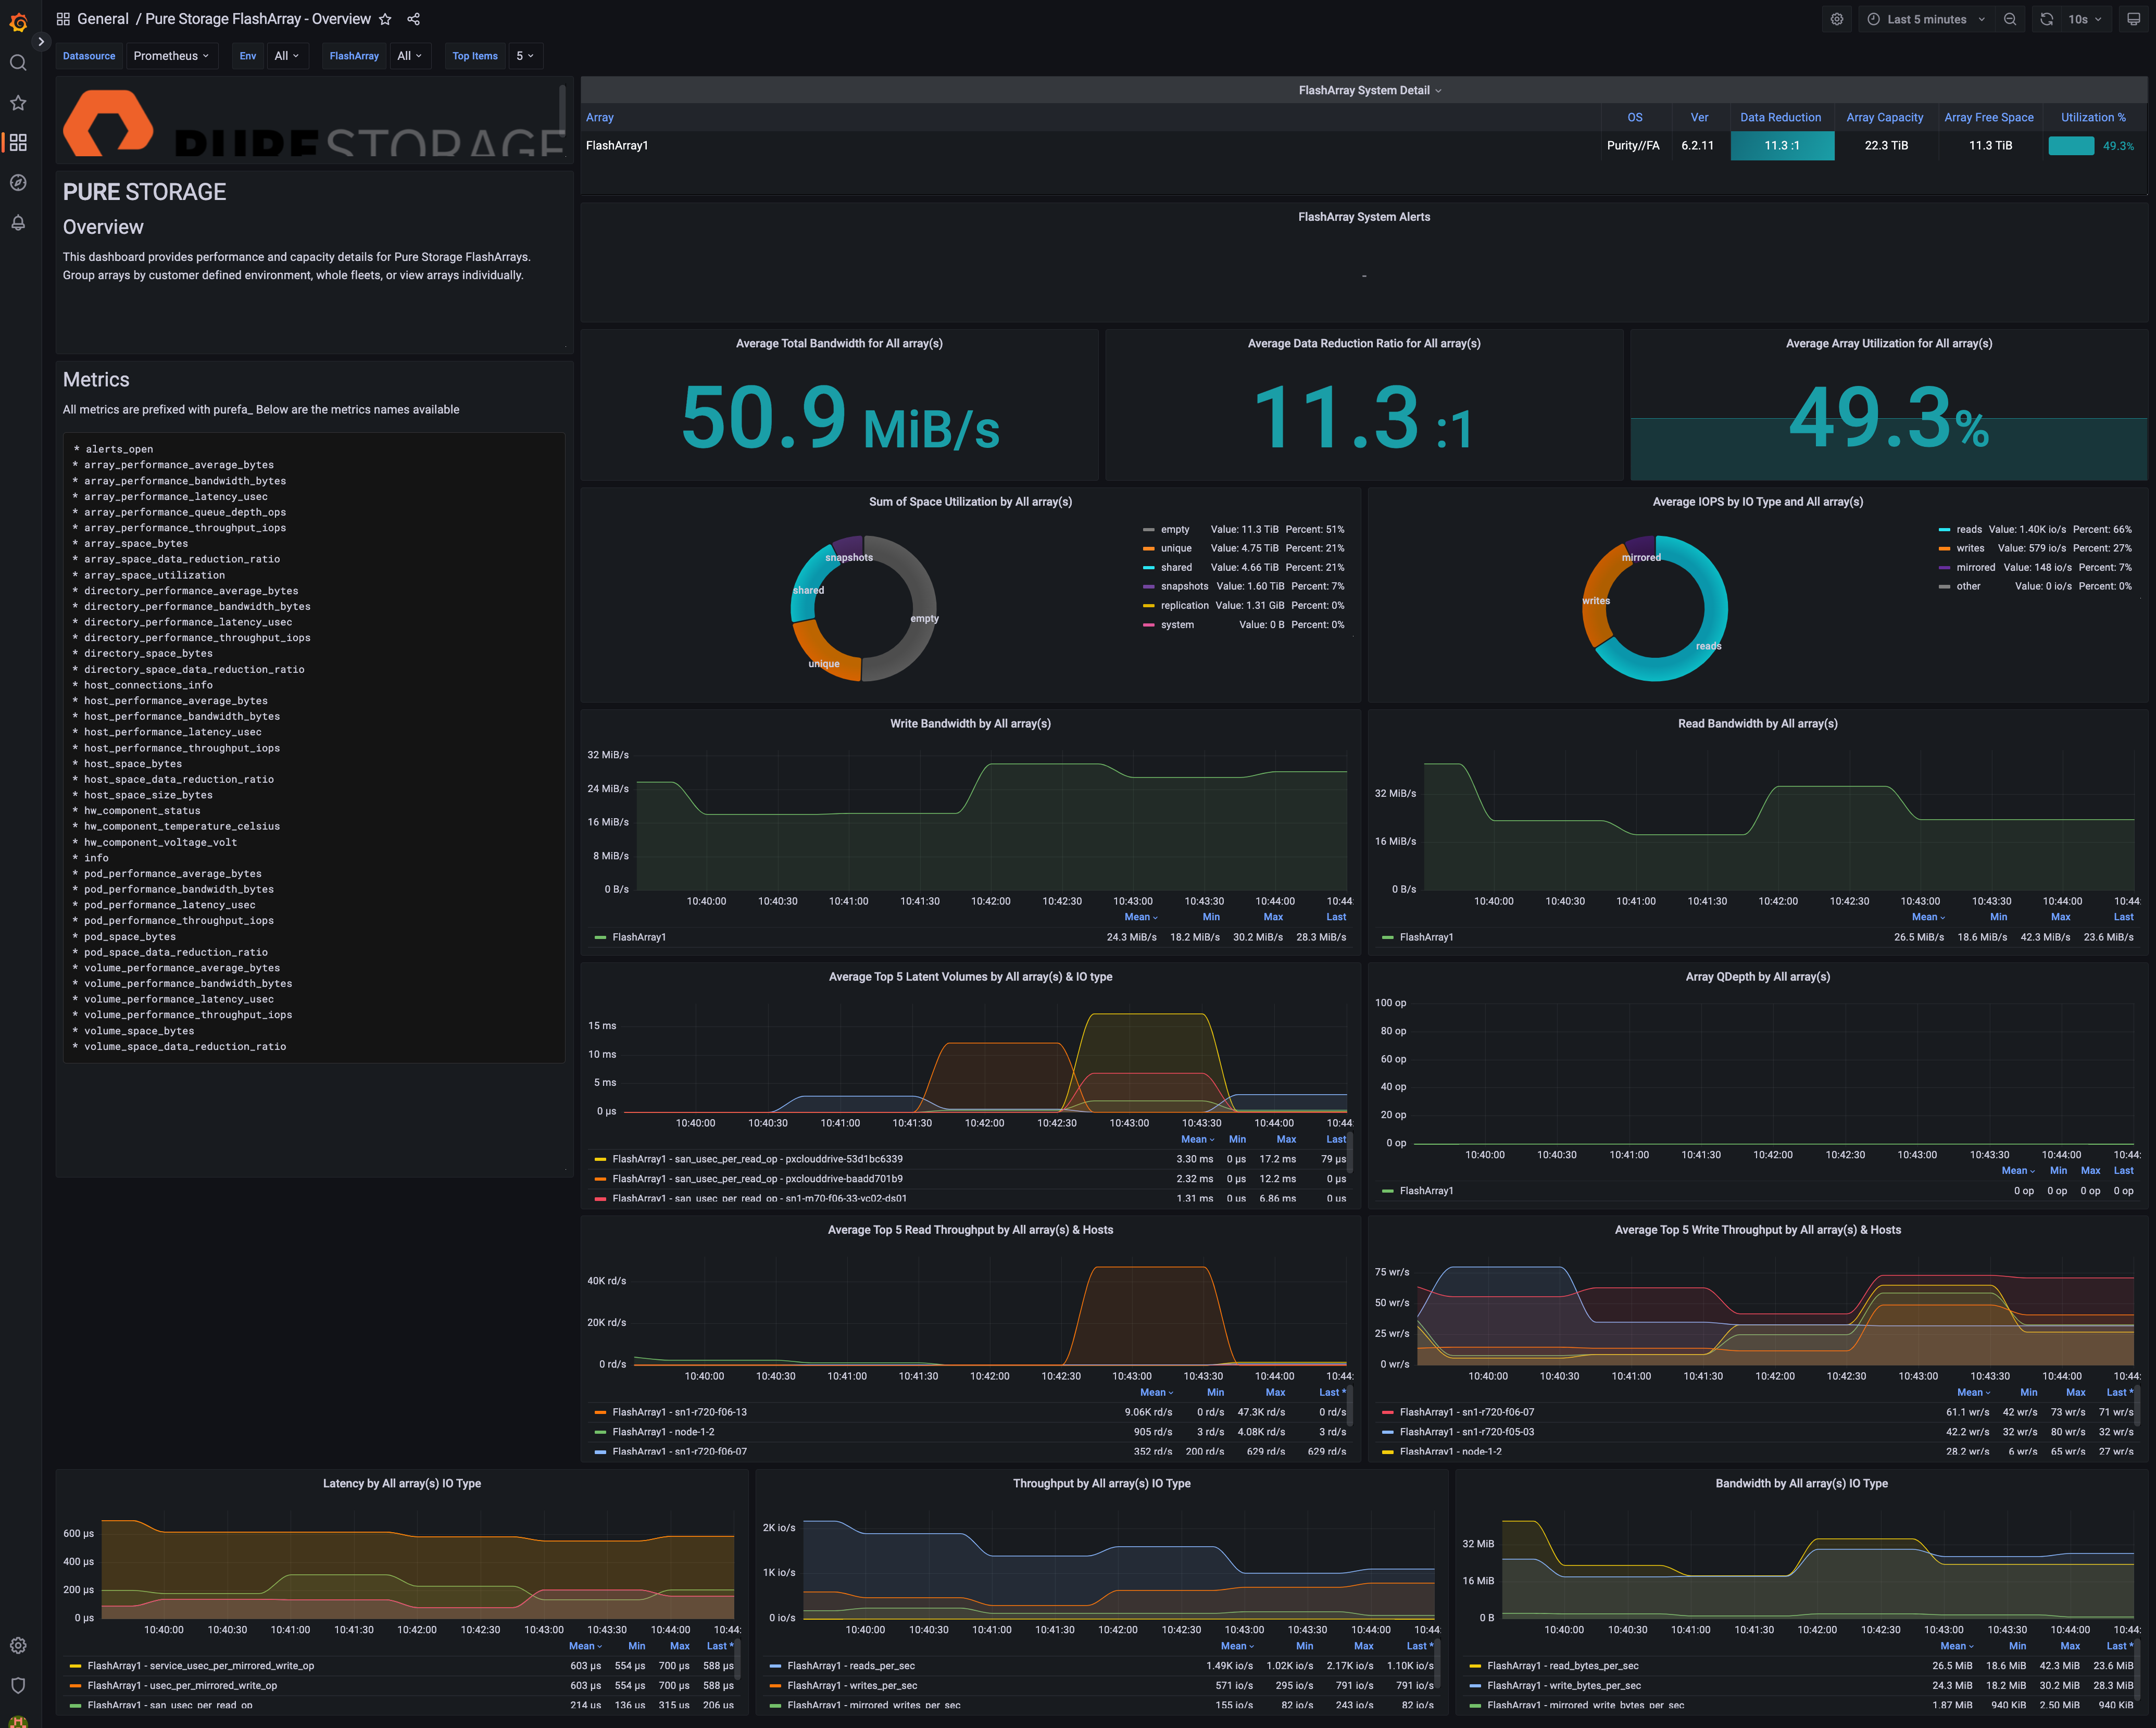 Click for a full size image.
What’s next
You can continue to configure the rest of your environment in Prometheus and customize the dashboards specific to your environment.
SQL Server Monitoring Extension
I’ve extended this monitoring platform with SQL Server-specific performance dashboards that correlate SQL Server metrics with FlashArray performance data. The SQL Server OpenMetrics Exporter for FlashArray provides:
- Custom SQL Server performance metrics exporters
- Pre-built Grafana dashboards showing SQL Server and FlashArray metrics side-by-side
- Correlation of database I/O patterns with storage performance
- Docker Compose configuration for easy deployment
This allows you to see the complete picture of your database workload performance, from the application layer down to the storage array.
These changes make it easier to get started with FlashArray monitoring by simplifying the deployment architecture and providing up-to-date configuration examples.