Monitoring SQL Server Performance with the Pure Storage FlashArray OpenMetrics Exporter
I’m excited to share a new open-source project I’ve been working on that combines two of my favorite areas: SQL Server and Pure Storage FlashArray performance monitoring. If you’ve been following my blog, you know I am passionate about creating tools that bridge the gap between database platforms and storage infrastructure.
SQL Server performance troubleshooting has always been a unique challenge, especially when it comes to understanding the complete I/O path from the database to storage. Traditionally, database administrators (DBAs) and storage administrators have used separate monitoring tools, which makes it difficult to correlate performance issues across the entire stack. Literally two different perspectives of their performance worlds.
After numerous conversations with customers who are struggling with this exact problem, I decided to build a solution that provides end-to-end visibility. Today, I want to share a monitoring platform that combines both SQL Server and FlashArray metrics, giving you visibility into your database performance from the application level all the way down to the storage layer. I’ve been using this a bunch as I work with SQL Server 2025 so that I can study how the new vector datatype and vector indexing structures perform at scale. These visualizations provide a ton of valuable insight into what’s happening under the hood.
Introducing pure-fa-openmetrics-exporter-sqlserver
The pure-fa-openmetrics-exporter-sqlserver repository provides a monitoring solution for SQL Server workloads running on Pure Storage FlashArray. This project builds upon the core Pure Storage OpenMetrics Exporter but adds specialized SQL Server metrics correlation.
What Problem Does This Solve?
If you manage SQL Server databases on Pure Storage FlashArrays, you’ve likely encountered this challenge: how do you correlate storage performance metrics with your database workloads? While you can separately monitor SQL Server and FlashArray, connecting those dots manually is time-consuming and often imprecise.
This solution bridges that gap by automatically correlating SQL Server database files with their underlying FlashArray volumes, giving you a complete picture of your database performance from application to storage.
Here is a screenshot of a sample dashboard displaying the read and write performance metrics from the database level, correlated to the FlashArray volumes on which those databases are stored.
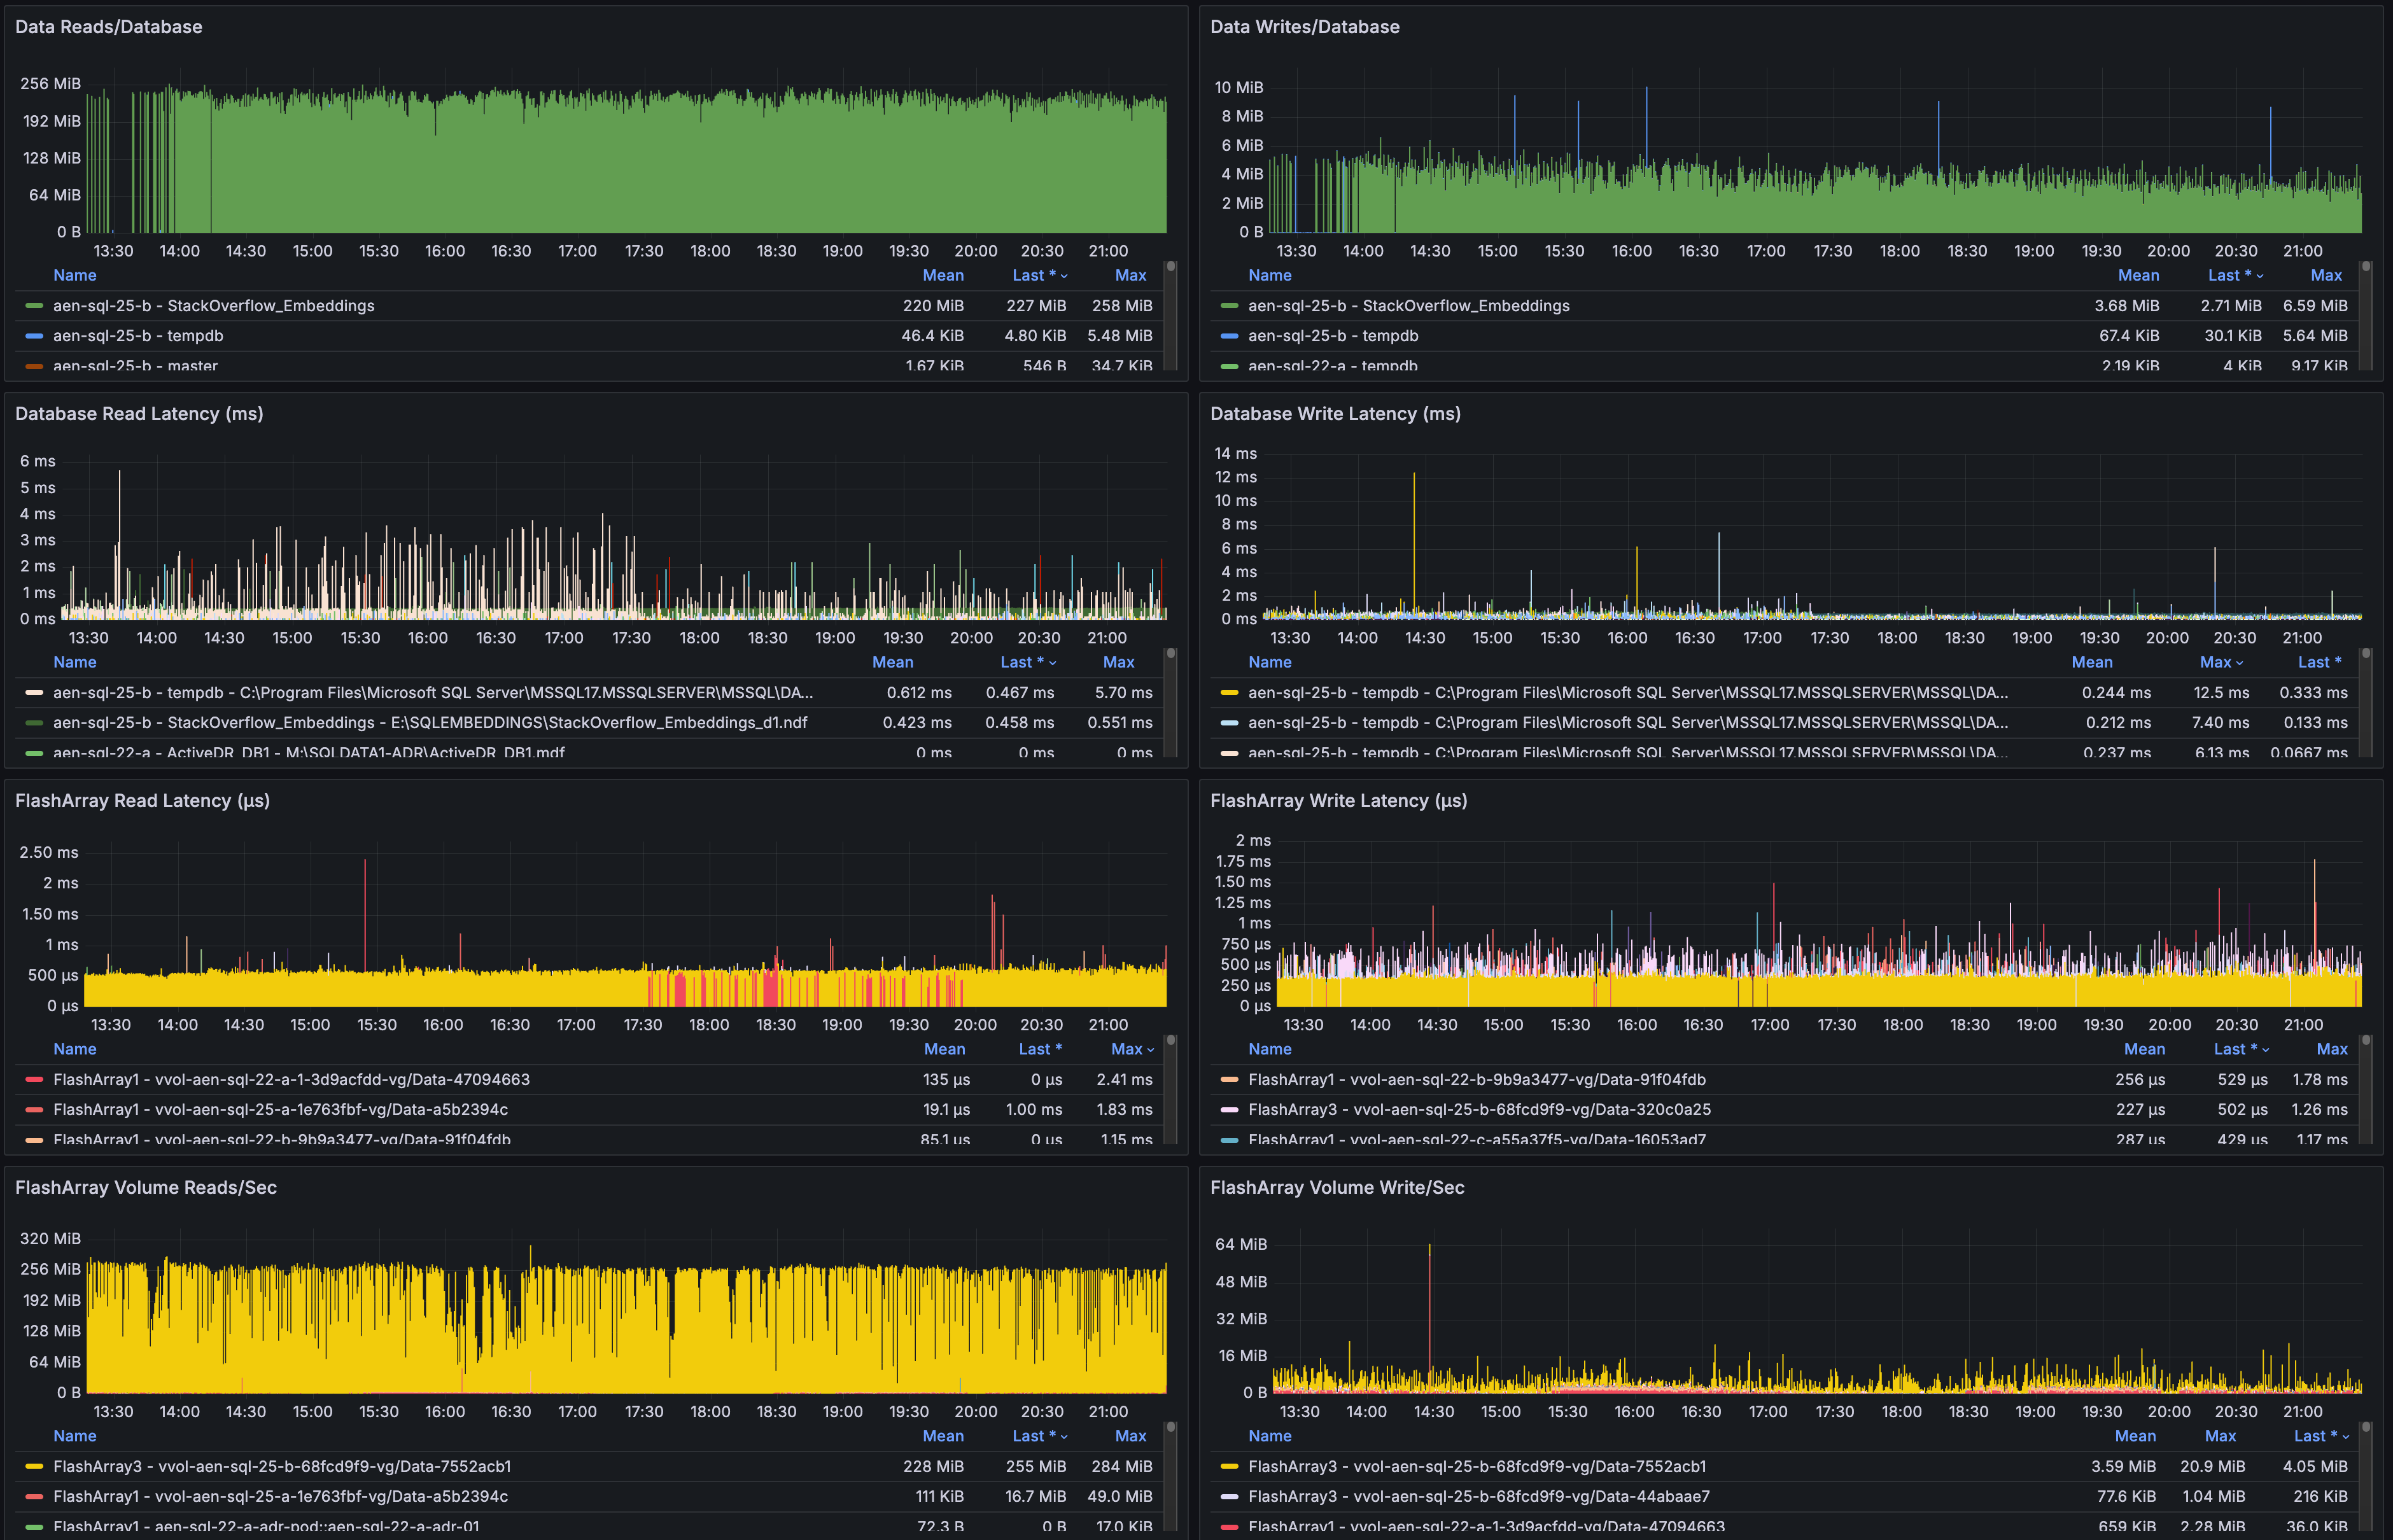
SQL Server Performance Dashboard
Key Features
- SQL Server Volume Correlation: Automatically maps SQL Server database files to their corresponding FlashArray volumes based on SQL Server and FlashArray Volume name
- Custom Grafana Dashboards: Pre-built visualizations that combine SQL Server and FlashArray metrics
- End-to-End Performance Visibility: See performance metrics from both SQL Server and storage perspectives
- Docker Deployment: Easy container-based deployment with Docker Compose
- Prometheus Integration: Leverages the OpenMetrics standard for easy integration with Prometheus
Components
- Pure FA OpenMetrics Exporter: Collects metrics from Pure Storage FlashArray
- Pure FB OpenMetrics Exporter: Collects metrics from Pure Storage FlashBlade
- Telegraf: Collects SQL Server metrics using the SQL Server input plugin
- Prometheus: Time-series database that stores all the collected metrics
- Grafana: Visualization platform with pre-configured dashboards
Getting Started
The repository includes Docker Compose files to get you up and running quickly. Here’s the simple path to implementation:
- Clone the repository
- Configure your FlashArray and SQL Server connection settings
- Start the containers with Docker Compose
- Access the pre-configured Grafana dashboards
This open-source solution brings together SQL Server and Pure Storage FlashArray monitoring to give you visibility into your database performance stack. Check out the GitHub pure-fa-openmetrics-exporter-sqlserver today and let me know how it works in your environment. Next steps, I would like to integrate Windows and possibly hypervisor level performance metrics to further add more detailed performance data to this monitoring environment.