Designing a Storage Load Test for SQL Server
Page content
I’ve been doing storage load tests for SQL Server for a long time, both as a consultant and now in my work at Everpure, and I see the same patterns over and over. Someone spins up a VM with two vCPUs, points it at a storage subsystem (cloud or on-prem), runs a thousand threads at it, and then concludes that the storage stinks. Or the opposite, where they buy a 64 gigabit HBA, plug it into the wrong PCIe slot, and wonder why they’re leaving half of the capacity on the table.
Designing a good load test isn’t about pushing the biggest number you can find. It’s about knowing what your gear is supposed to do, driving load until you find the point where the system breaks down, and measuring at the right places along the way. In this post, I’m going to walk you through how I think about designing a storage load test, the tools I reach for, and the pitfalls that will invalidate your results if you’re not paying attention.
Let’s go.
This post is the companion writeup to my webinar Load Testing Storage Performance for SQL Server. If you’d rather watch the talk, that’s where to find it.
Know What Your Hardware Can Do
Before you write a single line of a test plan, you need to know the performance profile of every component in the path. If you don’t know the target, you can’t tell when you’ve hit it, and more importantly, you can’t tell when something is misconfigured. The burden is on us to prove the system is functioning properly, so go grab the manuals.
Here’s the short list of things I want to know before I start:
- CPU clock rate - SQL Server dispatches IO on worker threads, and a single reader or writer thread is going to move only as fast as the clock rate of the CPU driving it. Parallelism happens at a higher layer with multiple worker threads, not inside a single IO thread. When I sized SQL Servers as a consultant, I asked for the highest clock rate and then scaled the system core count and then by socket count.
- HBA or NIC bandwidth and PCIe slot - A 64 gigabit HBA in a PCIe 3.0 x4 slot is not a 64 gigabit HBA anymore. Each PCIe generation and lane count contributes a known amount of throughput. Mismatch the card and the slot and you’ve built a bottleneck on day one. Check out the expected performance for PCIe versions and lanes here.
- Storage interconnect - Fiber channel or Ethernet, how many ports, what speeds, and what does the array side look like. A 2x16 Gb HBA pair on the host into a 6x16 Gb array gives you a known upper bound for throughput, 4 GB/s and 12 GB/s respectively.
- VM SKU limits in the cloud - Every cloud VM SKU publishes IOPS, throughput, and disk count limits. The disks themselves also have per-disk IOPS and throughput limits. If you attach one giant disk to a VM and wonder why you can’t hit the SKU’s published number, that’s why.
- Hypervisor configuration - Most SQL Servers run virtualized (survey data says about 89% are on VMware alone), and the hypervisor config will quietly cap your storage performance if you let it. For VMware use multiple paravirtual SCSI adapters with virtual disks balanced across them. I’ve walked into too many shops with twelve virtual disks hanging off a single LSI adapter. For the VMware side specifically, I distilled the official guidance in Best Practices for SQL Server on VMware - Distilled.
After all this research, you should have a number in gigabytes per second, in IOPS, and also a characteristic latency. These are the targets you’re going to shoot for in the load test. If you can’t hit them, something is misconfigured and the test has done its job by exposing it.
A Little Bit of Queueing Theory
There’s a concept from queueing theory called Little’s Law that I find incredibly useful for thinking about storage. The short version is that any system has three knobs:
- How much work it can do - throughput, or IOPS times IO size.
- How long each unit of work takes - latency.
- How much work is in flight - queue depth, which falls out of the first two.
Let’s say your storage system has a characteristic latency at low load. Maybe it’s 0.3 milliseconds. As you add more work, the system services it without breaking a sweat, latency stays flat, and throughput climbs. Then at some point you hit the knee in the curve. Latency starts climbing fast, throughput stops climbing, and queue depth blows up. That knee is the saturation point of the platform.
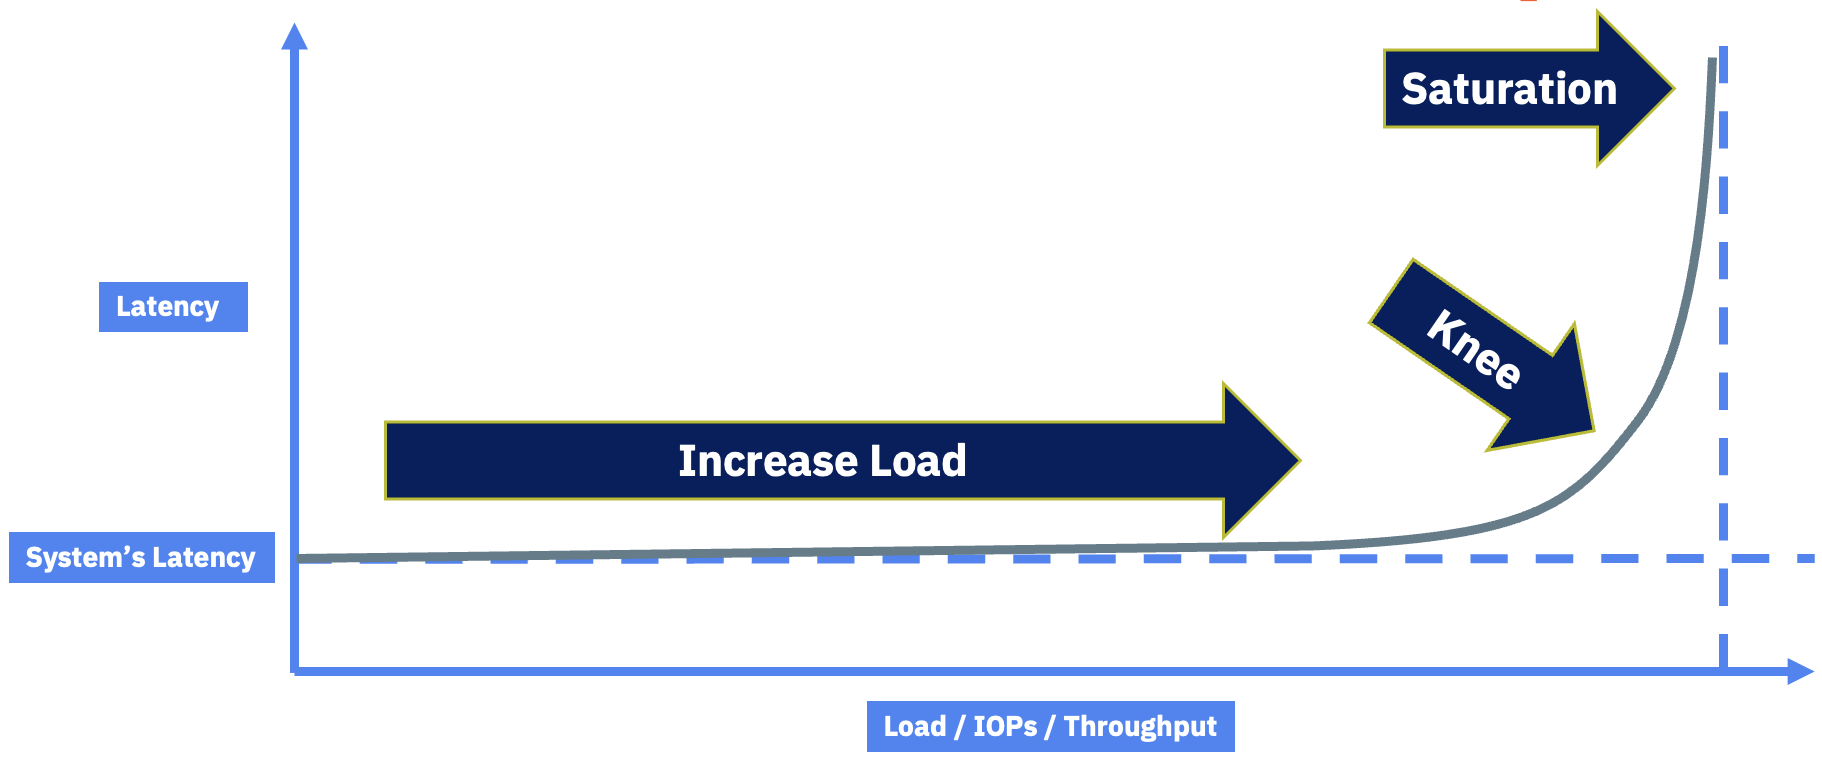
Figure 1: The latency-vs-load curve. The job of a good load test is to find the knee.
That knee is the target of a good load test. You want to drive load until you find it, not blow past it with a thousand threads and declare the storage broken. When you hit the knee, you have a decision to make: is the latency at that load point acceptable for your business, or not? Some workloads need 0.3 ms forever and you’ll back the load off. Others can tolerate higher latencies at peak. That’s a business question, not a storage question.
When you hit saturation, you have three ways to push the knee out:
- Do less work - reduce IOPS or throughput demand from the application.
- Make the pipe bigger - bigger HBAs/NICs, more lanes, faster networking.
- Make the back end faster - a storage controller with more CPU, faster media, or more connections to the storage network.
That’s the whole framework.
Synthetic vs. Real Workloads
People ask me all the time whether they should test with a synthetic workload or a real one. The honest answer is both, but for different reasons.
- Synthetic workloads - DiskSpd and HammerDB. You get tight control over IO size, queue depth, and concurrency. Perfect for characterizing the hardware and finding the knee.
- Real workloads - Replay an actual production trace, or measure a specific business process that matters. This is what tells you whether the platform is fast enough for your business, not someone’s reference architecture.
When I was consulting for a large American toy manufacturer, the metric that mattered was “add to cart through checkout in under 5 seconds at peak Black Friday load.” Nobody on that team cared about synthetic numbers. They cared about that one transaction, because if checkout takes a minute and a half, the customer closes the tab and goes somewhere else. We did some serious tuning to get there, the final bottleneck turned out to be last-page insert contention on a hot table, which is a real problem to solve. Find the equivalent of that transaction for your business and put it on the test plan.
That said, today we’re focused on storage, so we’re going to lean on the synthetic side.
SQL Server Doesn’t Do 8K IO
Here’s a myth I have to debunk constantly: SQL Server does not perform 8 KB IO. It also doesn’t perform 64 KB IO. SQL Server performs whatever IO size it needs to perform the operation it’s doing.
If someone tells you their platform needs a million IOPS, the right reply is “what’s your IO size?” because that’s what determines how fast the system actually has to be.
Rough numbers I see in the wild:
- OLTP reads - mid-30s KB on average.
- OLTP writes - mid-teens KB on average.
- OLAP reads - 100 to 200 KB, can hit 512 KB with read-ahead.
- OLAP writes - high 50s to 60s KB.
- Log flushes - anywhere from 512 bytes up to 60 KB.
- Backups - 1 to 4 MB by default, tunable down to 64 KB and up to 20 MB to S3 or blob.
You can pull your actual average read and write sizes out of sys.dm_io_virtual_file_stats. I walked through exactly how to do this and what the numbers mean in Understanding SQL Server IO Size. Whatever your application does, that’s what you want to test for in the synthetic workload.
This is also why I love using backups as a load test. I can dial the IO size and concurrency precisely, and I’m exercising the same code paths SQL Server uses for real work. You can run backups to DISK = 'NUL' to isolate read performance from write performance.
The Toolbox
These are the tools I actually reach for:
- DiskSpd - Pure synthetic, zero SQL Server involvement. Perfect for characterizing raw storage from a Windows host. Open source and still actively developed. Use the
-Shflag to disable file system and hardware caching, and-Lto capture latency. - HammerDB - TPROC-C and TPROC-H workloads (HammerDB’s TPC-C- and TPC-H-derived benchmarks) against an actual SQL Server. You’re now testing storage and SQL Server configuration together, which is closer to real life. My partner in crime Andrew Pruski and I containerized and parameterized HammerDB so you can spin up a test with a single command. Repo here: https://github.com/nocentino/hammerdb.
- SQL Server itself - Backups to
DISK = 'NUL', bigSELECTqueries against a known table, anything you can write in T-SQL.
DiskSpd focuses on raw storage. HammerDB pulls SQL Server configuration into the conversation, so when you use it to test storage, make sure you’re not accidentally measuring something else.
Walking a Test Up the Curve
Here’s the workflow I run every time. The principle is simple: start with one thread, find single-threaded read or write throughput, then scale up until you find the knee.
The system I use to demonstrate this in talks is an older physical box with a 2x16 Gb HBA into a 6x16 Gb array. Characteristic latency is around 0.3 ms, and the math says I should get about 4 GB/s out of the host’s HBA pair. That’s my target.
Step 1: Single-Threaded Baseline
Start with one outstanding IO and one thread. This tells you how fast a single CPU clock can move data through the entire stack.
diskspd.exe -d60 -b128K -o1 -t1 -Sh -L -w0 -c1G C:\testfile.dat
The flags that matter:
-d60- 60 second test.-b128K- 128 KB IO size, a reasonable OLAP read size.-o1 -t1- one outstanding IO, one thread.-Sh- disable file system and hardware caches. Critical. Without this you’re testing RAM.-L- capture latency percentiles.-w0- 100% read.
On my old box, this gives me about 400 MB/s at 0.3 ms latency. That’s the single-thread ceiling.
Important: Set the Windows power plan to High Performance before running any storage test. The “Balanced” plan lets the CPU drop clock rate when it thinks it’s idle, and that will absolutely skew your results. Think of it as the turbo button from old PCs.
Step 2: Scale Threads Until Latency Moves
Now I bump threads to 10, then 20, then 40, watching latency on each run.
| Threads | Throughput | Latency | Notes |
|---|---|---|---|
| 1 | 400 MB/s | 0.3 ms | Characteristic latency, baseline |
| 10 | 2,300 MB/s | 0.5 ms | Latency creeping, still healthy |
| 20 | 3,126 MB/s | 0.8 ms | Approaching the knee |
| 40 | ~3,200 MB/s | 1.59 ms | Past the knee, no more throughput, latency exploding |
That 40-thread run is the saturation point. I’m short of my 4 GB/s target, and latency has climbed more than 5x past the characteristic value and I’m getting diminishing returns on bandwidth with the last doubling of threads. Something in the path is the bottleneck.
This is exactly the knee in the curve I described earlier. The job of the load test was to find it.
Step 3: Figure Out What Saturated
When I look at the array side of this test, I can see that almost all of the 1.59 ms of latency at the 40-thread run is being spent on the wire between the HBA and the array, not on the host and not on the array. That tells me the bottleneck is the interconnect. On a Pure FlashArray, this is reported as SAN Time in the array-side metrics.
The dirty secret of the demo system is that I have the HBA in the wrong PCIe slot, intentionally. Move the card one slot over to a slot with the right number of lanes, and the bottleneck goes away. The load test didn’t fix the problem, but it told me exactly where to look.
Where You Measure Matters
This is the piece that often confuses people. You’ll have a DBA tell you query latency out to disk is 200 ms, and the storage admin will pull up the array and show you 0.3 ms, and they’ll both swear they’re right. They both are.
Here’s how to think about it. Going top-down, an IO can be measured at several layers:
- SQL Server DMVs and wait stats -
sys.dm_io_virtual_file_stats,PAGEIOLATCH_*waits. Counting starts when the worker thread asks SQLOS to issue an IO. If a thousand threads queue up behind a saturated subsystem, every single one of them accumulates wait time at this point. I walked through how to pull file-level latency out ofsys.dm_io_virtual_file_statsin Measuring SQL Server File Latency. - Windows perfmon -
Avg. Disk sec/Transfer(latency),Disk Bytes/sec(throughput),Disk Transfers/sec(IOPS),Avg. Disk Queue Length. Counting starts when the IO hits is passed on from SQL Server to the Operating System. Queueing here is the early warning. - HBA / fabric / NIC - How long the IO spent on the wire. On FlashArray we call this SAN time. Other vendors have similar metrics.
- Storage array - How long the controller actually took to service the IO once it arrived.
When the DBA says 200 ms and the array says 0.3 ms, both are telling the truth. The DBA is measuring disk queue + network connection + array. The array is measuring just itself. The 199.7 ms of difference is queueing somewhere up the stack, and that’s where the conversation needs to go.
Here’s a real example. I run a SELECT * against a 100 GB table with MAXDOP unbounded on a 48-core box, against a deliberately bottlenecked storage path:
- Top wait:
PAGEIOLATCH_SHat 28 ms. virtual_file_statsaverage stall: 235 ms.- Array-side latency: still 0.3 ms.
- What happened: 48 worker threads spun up, all dispatched IOs into a saturated path, and queued behind each other. Each worker thread is contributing to the 28 ms of
PAGEIOLATCH_SHwait time, and the 235 ms average file stall. The wait stats are real, but they’re measuring queueing of the excessive amount of work due to the unbounded concurrency, not the array.
Now I cap the same query at MAXDOP 2:
PAGEIOLATCH_SHdrops to 0.8 ms and falls off the top of the wait list.- Average file stall: 0.4 ms.
- Array-side latency: 0.3 ms.
Same hardware, same query, same data. The difference is I stopped trying to push 48 cores worth of IO through a saturated pipe. Testing design matters.
Finding the Knee with HammerDB and TPROC-C
DiskSpd tells you what the storage can do in isolation. HammerDB tells you what SQL Server can do with that storage, which is closer to what your business actually cares about. The same “walk it up the curve until you find the knee” process applies, you just have different knobs to turn and different metrics to watch.
For TPROC-C (HammerDB’s TPC-C-derived OLTP workload), the knob is virtual users and the metrics are NOPM (New Orders Per Minute) and TPM (Transaction Per Minute). NOPM is the workload-relevant throughput number. TPM is the total number of transactions of all types. As you add virtual users, NOPM and TPM should climb, plateau, and eventually drop off as the system saturates. That plateau point is the knee.
If you want the easy button, use my containerized and parameterized HammerDB so you can drive a TPROC-C test with a single command and an environment file. The repo is here: https://github.com/nocentino/hammerdb. I wrote up the framework in detail in Automated SQL Server Benchmarking with HammerDB and Docker.
Step 1: Build a Schema That Actually Stresses the System
The number of warehouses defines the size of the database, and you need enough that the working set doesn’t fit in the SQL Server buffer pool. If everything is cached in RAM, you’re not testing storage at all, you’re testing memory. A good rule of thumb is the database should be at least 2x the size of max server memory, and ideally larger. For a serious storage test, I want hundreds of warehouses, not a handful.
In hammerdb.env:
# TPROC-C Build settings: each warehouse is about 100MB of data, so 2500 warehouses is about 250GB
WAREHOUSES=2500                  # ~250GB database
TPROCC_BUILD_VIRTUAL_USERS=8    # roughly half your cores for the build
TPROCC_DRIVER_TYPE=timed
TPROCC_ALLWAREHOUSE=true
Schema build is a one-time cost. Once it’s done, you can run as many timed tests as you want without rebuilding. I keep some backups lying around of various sizes so I can stress different systems without rebuilding.
Step 2: Walk the Virtual User Count Up
Start small and double. The point is to find the knee, not to immediately blow past it. An example progression on a 16-core box looks like this:
| Virtual Users | What I’m Looking For |
|---|---|
| 4 | Baseline NOPM/TPM, characteristic latency |
| 8 | NOPM/TPM should scale up, latency flat |
| 16 | Approaching the knee, latency starting to creep |
| 32 | Past the knee, NOPM/TPM flattens or drops |
| 64 | Saturated, NOPM/TPM plateau or down, latency way up |
The number of virtual users you can drive without queuing collapse is a function of the number of cores in the box and the number of virtual users per core. For example, a 16-core box, I want to see at least 32 virtual users before I’m concerned. Each run wants a real ramp-up and a meaningful duration. I use five minutes of RAMPUP to let the buffer pool stabilize and 10 to 15 minutes of DURATION so I’m not measuring warmup transients. Anything shorter and you’re measuring noise, I’ve seen folks go up to an hour for duration.
VIRTUAL_USERS=16
RAMPUP=5
DURATION=10
TPROCC_USE_TRANSACTION_COUNTER=true
Then run it:
RUN_MODE=load BENCHMARK=tprocc docker compose up
Step 3: Plot NOPM, TPM, and Latency Together
After each run, you have NOPM, TPM, and the per-virtual-user response time data in output/. While the test is running, capture wait stats and sys.dm_io_virtual_file_stats from the SQL Server side and IOPS, throughput, and latency from the storage side.
One thing a lot of folks miss is that HammerDB itself reports per-transaction latency percentiles for each of the five TPROC-C transactions: NEWORD, PAYMENT, DELIVERY, OSTAT, and SLEV. You’ll find them in the load test output (and in output/ when you run the containerized framework). The columns you care about are minimum, p50, p95, p99, and maximum response time per transaction, in milliseconds.
You can pull this data directly from the HammerDB output, no need to pull it from the SQL Server side.
docker compose run --rm --no-TTY -e RUN_MODE=parse -e BENCHMARK=tprocc hammerdb
These numbers are great for finding the knee, because they describe the workload from the user’s perspective, not from the storage’s perspective. A run can have rising NOPM/TPM and still be heading off a cliff if p95 or p99 is climbing fast. That’s the user-visible queueing showing up before the throughput chart shows it.
Track them across your virtual user sweep the same way you tracked DiskSpd latency:
| Virtual Users | NOPM | NEWORD p95 |
NEWORD p99 |
What It Means |
|---|---|---|---|---|
| 4 | climbing | flat | flat | Healthy, headroom available |
| 8 | still climbing | still flat | still flat | Healthy, headroom available |
| 16 | still climbing | starting to creep | starting to creep | Approaching the knee |
| 32 | plateau | climbing fast | climbing faster | At or just past the knee |
| 64 | flat or dropping | spiking | spiking | Saturated, queueing collapse |
The signals to watch for at the knee:
- NOPM and TPM stop climbing even though you added more virtual users.
NEWORDp99 climbs sharply while p50 stays roughly flat. Tail latency is the early warning, it shows up before NOPM plateaus.WRITELOGjumps to the top of the wait list. Log flush latency is the bottleneck, not data file IO.PAGEIOLATCH_*climbs as data file reads start to queue behind each other.- Storage queue depth spikes while array-side latency may still look fine. That tells you the queueing is happening above the array.
- CPU pinned and NOPM/TPM dropping means you’re past the knee and into queueing collapse.
Step 4: Decide What to Do About the Knee
Same playbook as the DiskSpd test. When you find the knee, look at what saturated:
WRITELOGdominates - Your transaction log device can’t flush fast enough. This is where low-latency storage pays off, since log flushes are latency-sensitive, not throughput-sensitive.PAGEIOLATCH_*dominates - Data file reads are queueing. Either you need more throughput out to the data files, or your buffer pool is too small. Generally, I setmax server memoryartificially low to force more reads from disk. We’re testing storage, not memory.- CPU pinned, storage idle - You’re not bottlenecked on storage at all. Time to look at the query plans, the schema, or the VM SKU.
- Storage at its published limit - You hit the ceiling of the storage platform. That’s a hardware decision: bigger pipe, faster controller, more disks, different tier. It’s also possible that your system is fast enough for your workloads and you’re done.
The point of the TPROC-C run isn’t a leaderboard score. It’s the same point as the DiskSpd run: drive load until something gives, then figure out what gave.
Don’t Invalidate Your Own Test
A few things that ruin results:
- Noisy neighbors - Running a storage test on a hypervisor that’s also running production. You’re measuring the production workload, not the storage.
- Caches enabled - Forgetting
-Shon DiskSpd. You’re measuring DRAM, not storage. - Too short, too small, too serial - 30-second runs measure warmup, not steady state. Two-vCPU VMs can’t dispatch enough IO to saturate a real array. One data file on one virtual disk on one SCSI adapter serializes everything. Run for 5 to 10 minutes minimum, size the server appropriately, and spread files across volumes and adapters.
- Power plan on Balanced - Set it to High Performance.
- Comparing apples to oranges - A 128 KB sequential read test does not predict an 8 KB random write workload. Match your synthetic IO profile to your real workload’s IO profile.
Let’s Recap
If you want a starting point, this is roughly what I do for a new system:
- Document the targets - From the manuals: HBA/NIC throughput, PCIe slot bandwidth, array port count, VM SKU limits. Write down the expected MB/s and IOPS.
- Single-thread baseline with DiskSpd - One thread, one outstanding IO, your application’s average read size. Capture latency.
- Scale threads - 1, 4, 8, 16, 32, 64. Plot throughput and latency at each step. Find the knee.
- Repeat at write-heavy and mixed profiles - 100% write, then 70/30 read/write, with the IO sizes your application actually uses.
- Validate with a real-ish workload - Spin up HammerDB in containers and run TPROC-C. This brings SQL Server configuration into the picture, which is where the next layer of bottlenecks usually lives.
- Measure at every layer - Wait stats,
sys.dm_io_virtual_file_stats, perfmon, HBA, and array side by side. When numbers disagree, that disagreement is your next investigation. - Decide what good looks like - Compare the knee in the curve to the requirements of your business workload. Either it’s enough, or you have a specific direction to push: bigger pipes, faster controller, less concurrency.
Wrapping Up
The bottom line is that a good storage load test for SQL Server isn’t about generating the biggest number. It’s about knowing what the hardware is supposed to do, finding the saturation point, and being honest about where each measurement is coming from. If you do that, the test will either confirm the platform is healthy or it will point you straight at the misconfiguration. Either outcome is a win.
If you want a fast on-ramp for the SQL-Server-aware side of testing, grab the containerized HammerDB project here: https://github.com/nocentino/hammerdb. Clone it, point it at your SQL Server, and start walking the curve.
Get out in your lab and start testing. Your mileage will certainly vary, and that’s exactly the point.